Brief Summary
On this page, we describe the methods and results of the experiments examining the DNA circuit mentioned above. Also, in order to make the DNA circuit practical, Mismatch was introduced to the array
and experiments were carried out. The final goal was to move our designed DP gate bridge in the living body. Although this BIOMOD was not achieved because of time limits, we developed a means to conduct the experiment and predicted problems that
may occur (Click image to enlarge).
Material&Methods
1. Simulation Conditions
We set the binding rate constant (kf) based on toehold length as follows.
${\rm If\ toehold\ length\ \leq \ 6}$
$k_{f} = 5.0×10^{n-1}{\rm[M^{-1}s^{-1}]}$
${\rm else}$
$k_{f} = 3.0×10^{6}{\rm [M^{-1}s^{-1}]}$
${\rm Where}$
${\rm n:\ toehold\ length}$
2. Mismatch
We added a mismatched base pair to the DNA sequence to make the DNA circuit practical. There are two reasons.
The first is to react strand displacement reactions in the DNA circuit correctly.
The second is to not let the poly merase recognize the undesirable part.
2.1 What is mismatched base pair
A & T and C & G in DNA bases are held to each other through hydrogen-bonding known as Watson-Crick base pairs, but other combinations have been reported (e.g. A and G). We refer to these as
mismatched base pairs. The binding strength of mismatched base pairs is weaker than that of Watson-Crick base pairs, but the binding strength between G and T is stronger among mismatched base pairs. An example of a mismatched base pair is
shown below. In Table 1, base sequence (A) is completely complementary to the double-stranded DNA, (B) is double-stranded DNA containing four mismatched C-A base pairs, and (C) is double-stranded DNA containing four mismatched G-T base pairs.

We examined whether these base sequences formed double-stranded DNA using NUPACK [7] (a software suite for analyzing and designing nucleic acid structures). The results are shown below.
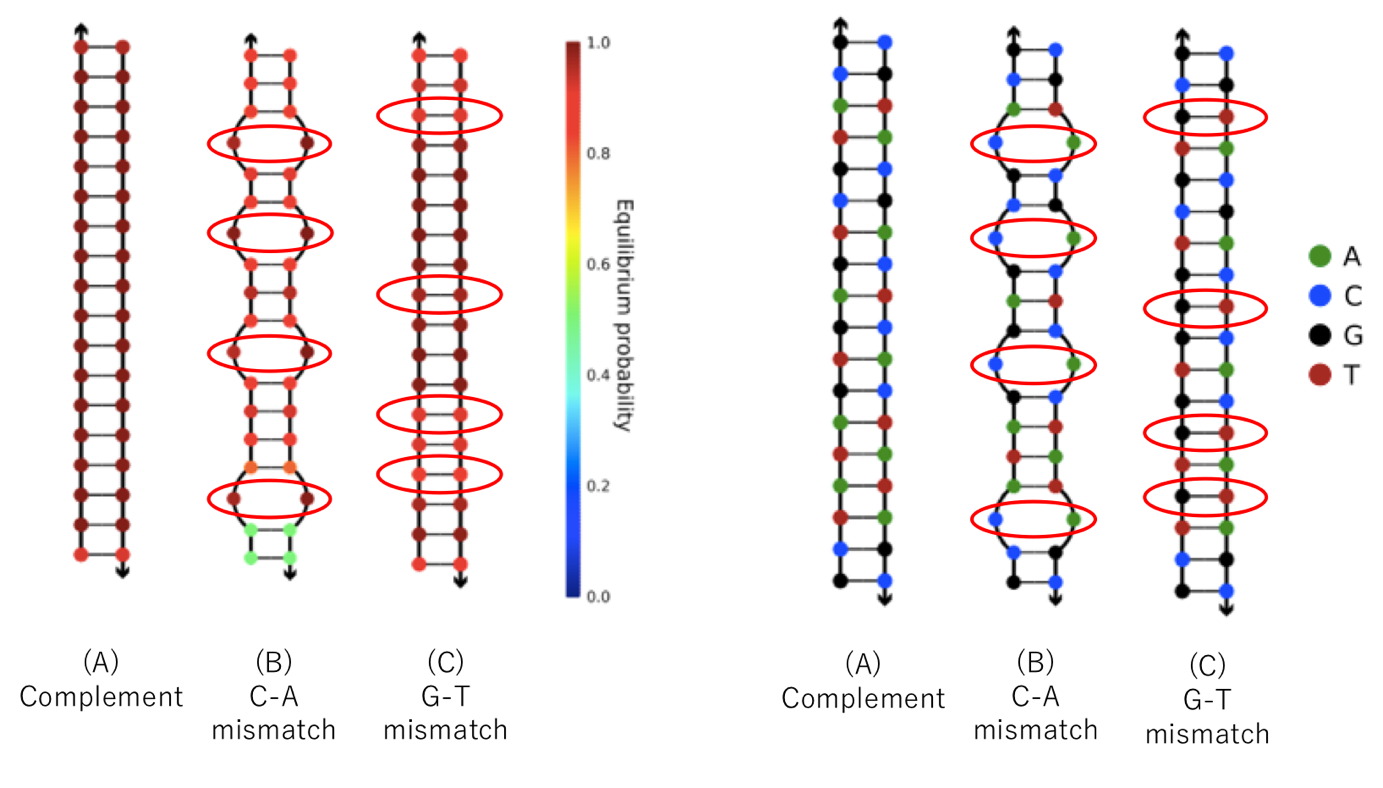
As shown in Figure 2, G and T clearly bind to each other, while A and C do not.
2.2 Use of Mismatches
When DNA (A) and (B), which we expect to be double-stranded, contain mismatched GT base pairs, DNA (C), which is completely complementary to (A), and DNA (D), which is completely complementary to (B), form mismatched CA base pairs. Therefore, (A) is bound to (B) while (C) is not bound to (D) (Figure 3).

In this project, we added four mismatched base pairs and added (m1), (m2), (m3), and (m4) preceding the domain names. We show the
NUPACK results for each added mismatched base pair below. (m1) Input & Absorber (OFF) As previously stated, Input and (OFF) are complementary and thus hybridize. We added a mismatched base pair here (Figure 4). The results of NUPACK as analysis
are shown in Figure 5. Red characters show the desired reactions (same hereinafter).
Input&Absorber(OFF).png)
.png)
(m2) Signal1 & Signal2
Similarly, Signal1 and Signal2 are complementary and thus hybridize. They should be completely complementary, but unlike (m1). We added
a mismatched base pair to Signal1 for binding with Absorber (Figure 6). The results of NUPACK as analysis are shown in Figure 7.
 Signal1 & Signal2.png)
.png)
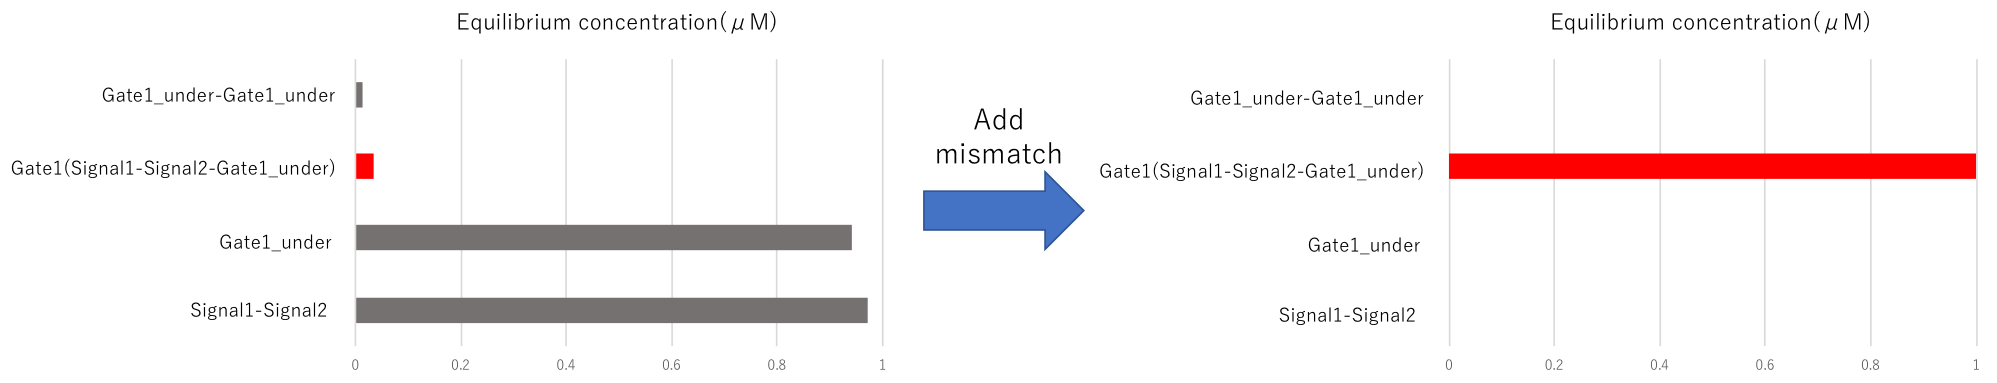
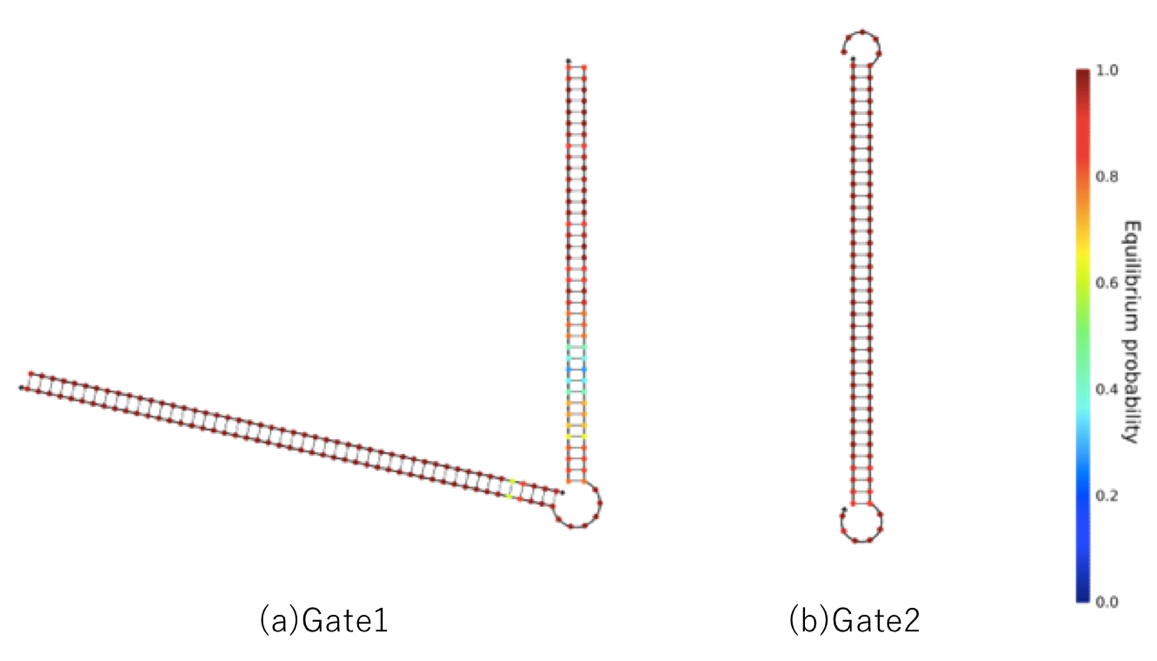
Also, Gate 1_Under takes a hairpin structure, and Gate 1 is not generated. We improved it by mismatched base pair
(m3) Input & Gate2
We also added mismatched base pair Input and Gate2 because this starts a reaction from T3, which is the toehold (Figure 9).
 Input & Gate2.png)
(m4) Gate2
The polymerase reaction occurred because Gate2 contains the T7 promoter sequence. We also added mismatched base pair here to prevent T7 RNA polymerase from
recognizing the T7 promoter sequence (Figure 10).
 Gate2.png)
A new scheme of the circuit containing mismatched base pairs is shown in Figure 11.
This is predicted to reduce undesired reactions. NUPACK's evaluation of bonding strength of double-stranded DNA containing a mismatched base pair is shown in Figure 12. This includes the mismatched
base pair G-T; however, we found that binding strength remained strong.
Additionally, the T7 RNA promoter disappears, except that the circuit is in the ON state when the mismatched base pair is added; these problems were solved as shown in Figure 13.
3. Type of Strands
We designed the strands shown in Figure 14.
.gif)
Additionally, we designed DNA sequences using NUPACK. The DNA sequences are shown in Table 2. NUPACK can design DNA sequences and evaluate their secondary structures at room temperature.

4. Wet Experiment of ATP Controller
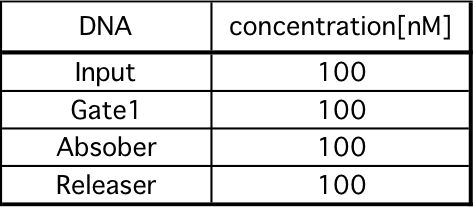
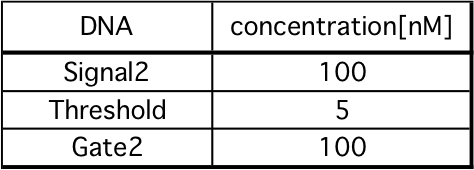
1) Dliute
We diluted each strand until reaching the desired concentration, as shown in Table x below. The experiment was performed at 20°C in Tris - EDTA buffer supplemented with 12.5mM MgCl2.
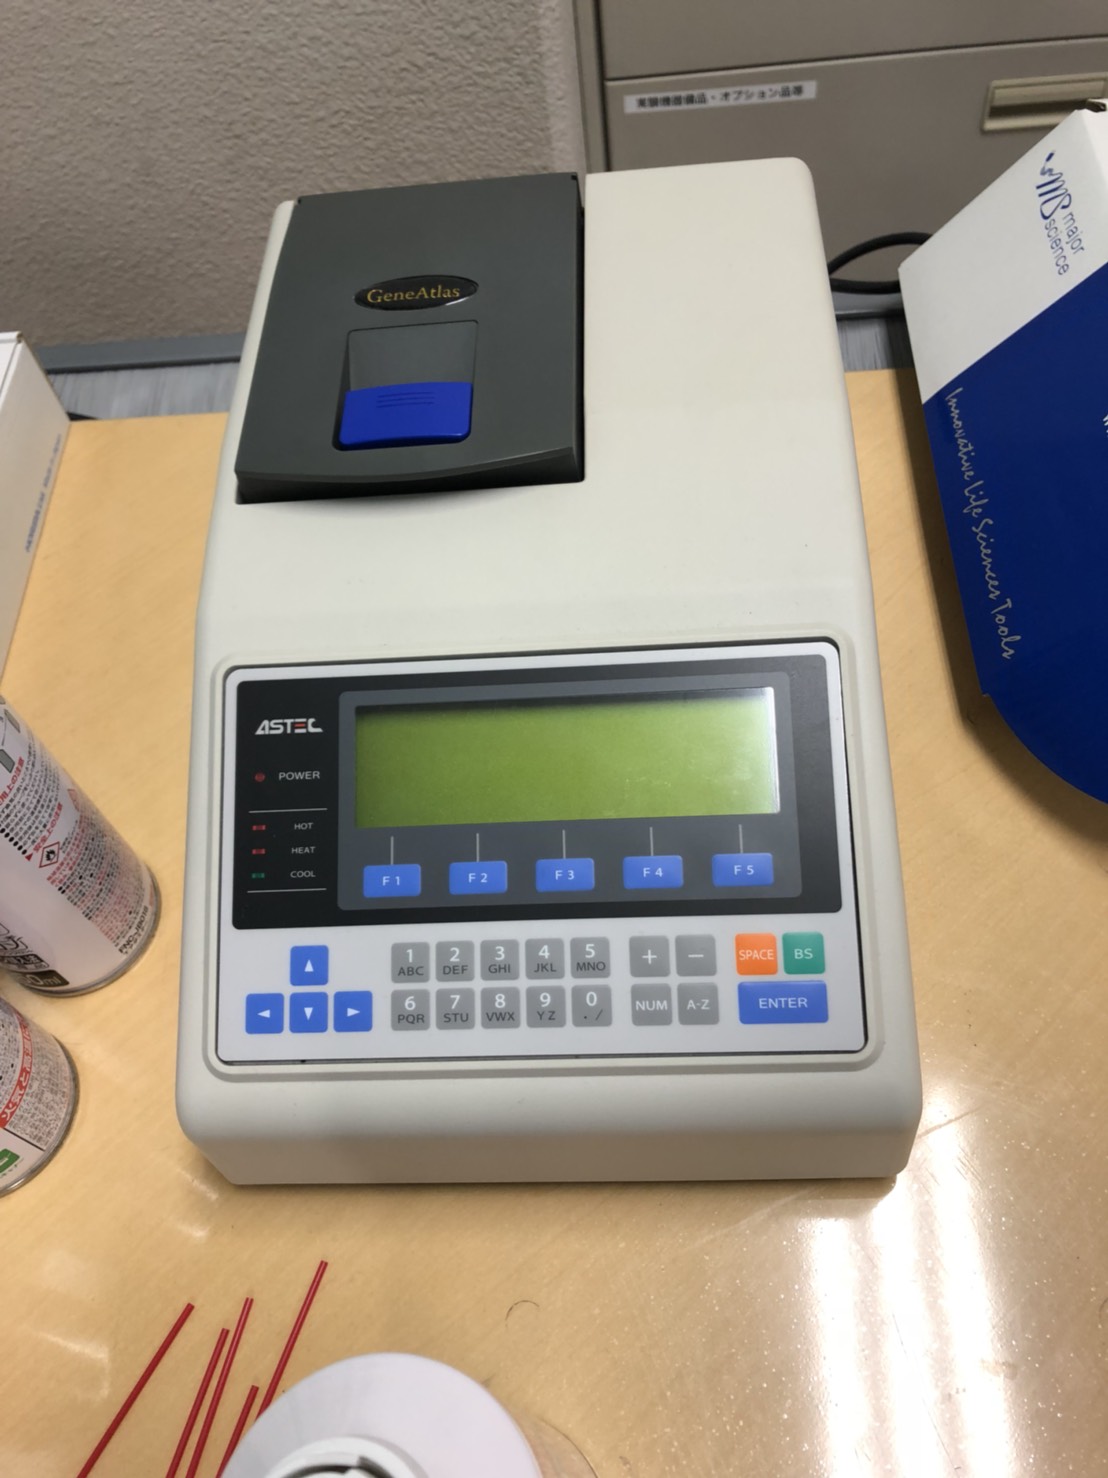
2) Annealing
Using Thermal cycler ( ASTEC325; GeneAtlas ), we annealed each DNA from 95 to 20°C ( - 1°C/min) after heating at 95°C .
3) Reporter intensity measurements
Using a spectrofluoremeter (FP - 8300; JASCO) , We measured the Reporter intensity for Xh with X-min intervals.

4) Reaction confirmation
We applied FRET to confirm how much output was released. For confirmation of ON - OFF reaction, we qualify 5 - FAM for 5’ terminal of Signal1 and BHQ1 for 3’ terminal of Absorber. When the Absorber
is in the ON state, the 5 - FAM did not fluoresce since the Reporter of 5-FAM was Absorbed by BHQ1.On the other hand, when it is in the OFF state, the Absorber of 5-FAM became detectable because the distance between the 5 - FAM and BHQ1 molecules
increased. Also, for confirmation of delay element, we qualify Cy5 for 5’terminal of releaser and BHQ2 for 3’terminal of releaser_under.When Gate2 reacted with Signal,the Releaser of Cy5 became detectable because the distance between
the Cy5 and BHQ 2 molecules increased.
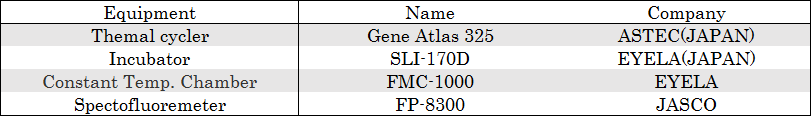
5. Equipment
Equipments were purchased from the conpanies indicated below.
Operation Experiment
1. Outline of experiment
We propose an ON - OFF switch circuit for T7 RNA polymerase reaction. There are three goals of our circuit. There are three goals of our ON - OFF circuit. The first is to utilize only the DNA strand displacement reaction. The second is to proceed the reaction autonomously. The third is to be able to control time. In order to achieve these goals, we conducted the following two step experiments.
1. Manual switching of ON-OFF
2. Delay element

The results and discussion of each experiment are shown below.
2. Experiment1. Manual switching of ON-OFF
First, we confirmed that the ON-OFF switch operates manually. The experiment procedure is shown below.
1. Set a mixture of Gate1 and Absorber to spectrofluoremeter (FP-8300; JASCO).
2. After 5 minutes, mix Input.
3. After convergence, mix Releaser.
This result means that the ON - OFF switch can be controlled manually. In the reaction pathway, there was a problem that leakage reaction occurred. We could mitigate these leakage reactions by using mismatched base pairs. ON - OFF switch is in operation,
but the change from ON to OFF is small. We consider that this will be improved by increasing the concentration of Releaser.
Experiment2. Delay element
Next, we confirmed the behavior of Delay element. The experiment procedure is shown below.
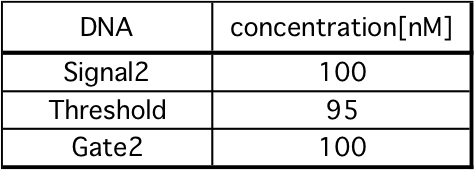
1. Set a mixture of Gate2 and Threshold to spectrofluoremeter (FP-8300; JASCO).
2. After 5 minutes, mix Signal2.

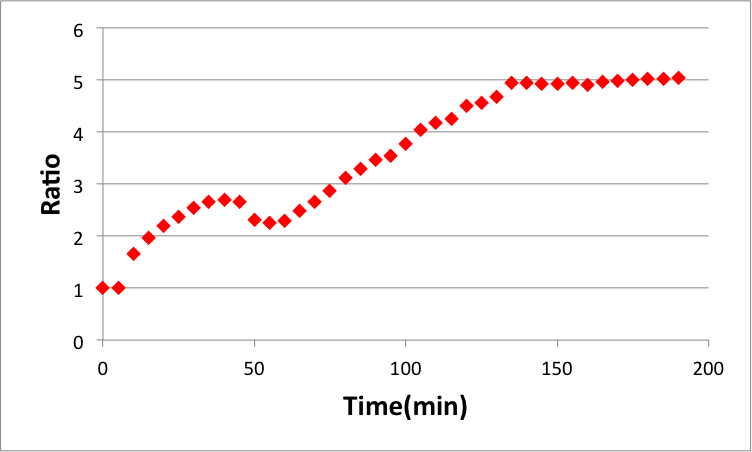
Fig 18 and 19 show Releaser output when Threshold is 5 nM or 95 nM, respectively. These comparisons are shown in the Fig 20. As in our simulation, we confirmed that the output of Releaser is delayed as
the Threshold concentration increases.

Future work
In this BIOMOD, it was impossible to confirm the operation by the auto in the whole circuit due to the circumstances of time. However, based on these results, we consider that overall operation is possible. We believe the success of this circuit will lead to further development of DNA computing.
Consideration
1. T7promotor mutation
T7 RNA polymerase recognizes the T7 promoter sequence and synthesizes RNA that will be a copy of the downstream sequence using ATP in buffer. This experiment was designed to prevent recognition of
the T7 promoter by using mismatched base pairs. Therefore, we injected the T7 promoter containing mismatches into Escherichia coli with T7 RNA polymerase and examined whether polymerase recognized the sequence.
1.1. Experiment method
Experiments are performed in E. coli using cyclic DNA known as a plasmid. The T7 promoter sequence containing a mismatch should be incorporated into the plasmid sequence, as well as a downstream sequence
that produces a green fluorescent protein known as GFP. This plasmid is introduced into E. coli, and GFP fluorescence is observed. We decided to investigate the factors that the T7 promoter begins to recognize sequences by incrementing mismatches
step by step.
1.2. Experiment contents
①Production of mutated plasmids
First, we designed a mismatch sequence changed at one position at the end of the T7 promoter sequence.

This was done to maintain a similar bond strength as the original two DNAs. Next, a plasmid containing the designed DNA sequence was extracted and amplified by PCR. Water, dNTPs, primers, templates,
KODFXNEO, and other components were prepared in a total volume of 50 μL mutated plasmids were synthesized in 3 h. Thereafter, because plasmids with mutation and no mutation were present in the solution, the original plasmid without mutation was
digested with DPN (enzyme). The reaction solution contained DPN (1 μm),・TBuffer X 10 (1 μm), Solution (8 μm) Mutate, which was mixed with the plasmid and introduced into E. coli for plasmid amplification. Escherichia coli used at this time was
named as DHSr, which does not contain T7 RNA polymerase, and was used to increase the amount of plasmid. The plasmid was mixed with competent cells on ice and incubated for 30 min. Incubate for 30 s, followed by incubation at 37°C for 1 h. The
solution was transferred to a culture dish containing medium and the cells were grown overnight. Using a MiniPrep kit, the plasmid was extracted from E. coli and measured. Sequencing was carried out to confirm the presence of the mutation.

②Confirmation of reaction of mutated plasmid
Next, the extracted mutant plasmid was introduced into E. coli BL21 (DE3) containing T7 RNA polymerase. In the same manner as in ①, the plasmid containing the mutation was introduced into E.
coli and cultured for 1 day, after which GFP fluorescence was confirmed.

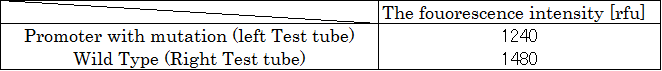
1.3. Experiment result
Production of mutated plasmid by ① was successful. After introduction into E. coli at ①, the following results were obtained.
Fluorescence was confirmed, indicating that polymerase recognized the mutated T7 promoter sequence.A test tube with mutation on the left. Wild type on the right.

Each test tube was diluted to 1/100 and the fluorescence intensity was measured with a fluorometer. The Table 8 below shows the result.
1.4. T7promotor Experiment
Based on the above results, when one part of the end of the sequence was changed, polymerase recognized this sequence. We could not conduct further experiments during this BIOMOD period, but based
on this experiment, we reviewed a previous study which added a mismatch to the promoter sequence. According to the paper, promoter sequences were found to be meaningful for enzymes in each sequence (See the figure from the paper). The mutation
was added to position 0, which is a sequence that affects the synthesis rate from mRNA to protein. In the previous study, a mutation was inserted between position -17 of the promoter sequence and position -5, followed by analysis. Particularly,
mismatches were introduced from -9 to -5; based on these results, the optimal mismatch base can be introduced into our promoter sequence.

2. Experiment in vivo
The final goal is to move our designed DP gate bridge in the living body. Although this BIOMOD could not be achieved because of the time limit, we developed an experimental method and predicted problems that may arise.
2.1. Outline of experiment
The DPgate bridge is introduced into E. coli and absorption of ATP is detected. Additionally, differences in the reaction time and whether the DNA circuit is working well are examined.
2.2. Experiment method
The plasmid is introduced into E. coli (BL21 (DE3)) by electroporation or other similar methods. The electroporation method involves electric pulsing of the cell membrane to create pores, through which DNA enters the cell. Other methods can also be used to deliver DNA into cells. Next, the movement of the circuit will be tracked by measuring the change in the amount of ATP in the cell over time.
2.3. Problems
It is unknown whether the DNA circuit actually moves. As E. coli divides over time, the number of circuits in the cell will decrease. In the case of a plasmid, a process that divides the plasmid simultaneously occurs when E. coli divides, but whether the same process can be added to the DNA circuit is unknown. As a solution, the rate of proliferation of E. coli slows at low temperature; thus, if the cells are cultured at a low temperature, the influence of intracellular dilution can be suppressed.